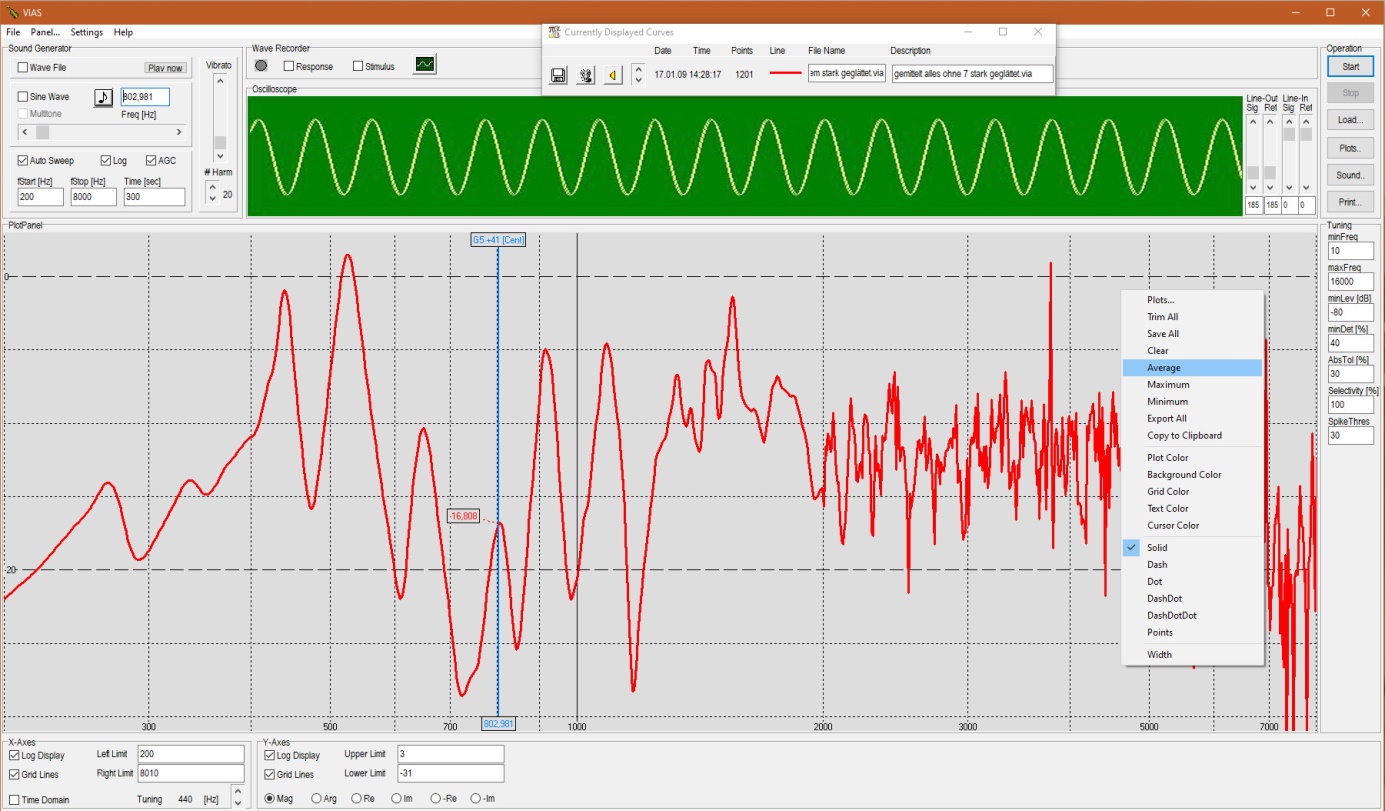
The following figure shows the Main Screen. On the top left is the audio section, here you select the type and parameters of the excitation signal or which tones you want to hear from the measured instrument or several comparison instruments. To the right is the “Oscillator Window” where you can observe the excitation signal and the measured signal.
Next to it on the right, the sliders can be used to adjust the level of the two signals to prevent clipping and overload.
Below is the plot area (graphic area). The figure shows the admittance curve of a Stradivarius. Frequency range shown: 200Hz – 8000Hz with logarithmic frequency axis. From 200Hz to 2000Hz the curve is already smoothed by a factor of 2 for the sake of clarity, beyond that up to 8000Hz you see the original data.
A click with the right mouse button in the graphic area opens the context menu, which allows all conceivable operational and graphic settings. The one shown in the figure is only one of several such context menus.
Below the plot area you can scale the X- and Y-axis as you wish, choose separately between linear and logarithmic display, and display all complex parts of the impedance and admittance data. All changes can be made while the measurement is running and without affecting it.
The most important operational buttons are located at the top right of the sliders: “Start” and “Stop” of the measurement process, “Load” loading of a saved measurement, “Plots” lists all displayed curves and “Sound” starts the sound analyses.

